Eco-Friendly Home Experiments: Test Your Space for Energy Efficiency
This post may contain affiliate links which might earn us money. Please read my Disclosure and Privacy policies here
Want a fast way to learn where a home is losing comfort and money? These eco-friendly home experiments turn a weekend into a small science experiment that points to energy efficiency fixes, using a thermometer, a timer, and careful notes.
Match the test to the biggest complaint: Drafts near windows and doors mean it's time to check for leaks. Try using a damp hand or incense to map where air is getting in. Add weatherstripping to seal the worst gaps.
If one room feels hotter or colder than the rest, test for poor insulation. Place equal cups of warm water in different areas. Track how fast the temperature drops. Add insulation where the cooling happens fastest.
High energy bills without a clear reason may point to heat loss through windows. Check by comparing indoor surface temperatures with the curtains open versus closed. Use thicker or tighter shades at night to reduce heat loss.
For sun-driven swings, run a passive solar and shade test: Check the room temperature at the same time of day with blinds open and then closed. Use this to adjust for more winter sun and better summer shade.
Next, build a simple solar water heater experiment. Use a dark bottle inside a clear box. Measure how much the water temperature rises. This helps you decide if solar preheating is worth expanding.
Before starting, set up a three-column table. Record what you’re measuring, such as temperature, time, and location. Define what “better” means for each test.
Repeat each reading to find patterns—not perfection. Keep your energy-saving efforts practical and realistic.
Set Up a Mini Home Energy Lab (Tools, Safety, and a Repeatable Method)
Tools You Probably Already Have (And What Each Is For)
- Thermometer (and when an infrared thermometer helps)
A thermometer tracks temperature for a science experiment; it sits at chest height, away from vents and the sun. An infrared thermometer helps when comparing surface temperature on glass, walls, or floors without touching them. - Tape measure, painter’s tape, flashlight
A tape measure keeps distances consistent, painter’s tape marks the spot for repeat readings, and a flashlight reveals gaps around window frames and baseboards in low light. - Notebook or spreadsheet for logging
A notebook records time and location. A table keeps readings comparable, and the home energy efficiency basics guide helps define what to track.
Make It a Real Experiment: Variables, Controls, and Timing
- Baseline measurement
In the scientific method, a hypothesis comes first; temperature is recorded every five minutes for 30 minutes. - One change at a time
One variable changes, then measurements are taken again. - Same time of day when possible
Trials work best at similar times, and families stay safer around hot water, sharp tools, ladders, and glass nearby.
Experiment: Compare Insulation Performance With a Heat-Loss Test
What You’re Testing (And What ‘R-Value’ Does and Doesn’t Tell You)
R-Value as Resistance to Heat Flow
R-value describes how strongly an insulation layer resists heat flow under lab conditions. It helps compare materials, but it does not capture air leaks, moisture, or installation quality. If you want a second set of eyes on what’s really happening in your house beyond the numbers, GCL Home Service can help.
Why Gaps and Compression Can Beat ‘Good’ Materials
A highly rated product can underperform if it gets compressed, leaves edges exposed, or has gaps that let air move. In real homes, stopping air movement often matters as much as adding thickness for energy efficiency.
For additional background info, see the U.S. Department of Energy guidance on insulation and R-values.
Step-By-Step Setup and Measurement
Choose Materials to Compare (Fabric, Foam, Bubble Wrap, Etc.)
Pick several samples, each cut to the same size: towel fabric, foam, bubble wrap, cardboard, or a doubled layer. Wrap each around the same type of lidded jar, leaving the bottom uncovered so every trial loses heat the same way.
Run Identical Trials and Log Temperature Drop Over Time
Fill each container with the same volume of hot water and confirm the same starting temperature. Place them side by side in one room, away from the sun, vents, and exterior doors. Record temperature at the start and at regular intervals, then compare end values or sketch a simple cooling curve.
Common errors include loose lids, different jar sizes, and reading the thermometer at different depths. Keep conditions steady: start each trial at the same temperature, avoid air movement, and repeat the run to confirm energy conservation.
Ways to Extend the Test Beyond the Tabletop
Attic Hatch or Basement Rim Joist Spot Checks
Repeat the readings near an attic hatch or rim joist using a cup as a reference, noting faster cooling near nearby underinsulated areas.
Draft Points Where Insulation and Air Sealing Overlap
Run the same test near suspected draft paths where insulation meets framing. Minimize error by keeping the cup in one spot, shielding it from cross-breezes, and reading the thermometer the same way each time.
Experiment: Measure Window Heat Loss and Test Different Coverings
Where to Measure for the Clearest Signal
Center of Glass vs Near the Frame
Mark two spots with painter’s tape: mid-pane and 2 inches from the frame. Take surface readings with an infrared thermometer, or press a probe gently to the same spots. Edges often read colder because the frame conducts heat.
Indoor Air a Few Inches From the Window
At night and again at breakfast, measure air temperature 3 to 6 inches from the glass at chest height, then compare it to a reading on an interior wall in the same room. A bigger gap suggests stronger convective drafts and poorer insulation.
Comparing Single-Pane vs Double-Glazed Windows (If You Have Both)
Repeat the same measurements on each window. Double-glazed windows typically show warmer glass and a smaller air-temperature drop nearby, which usually feels less “cold radiating” from the pane.
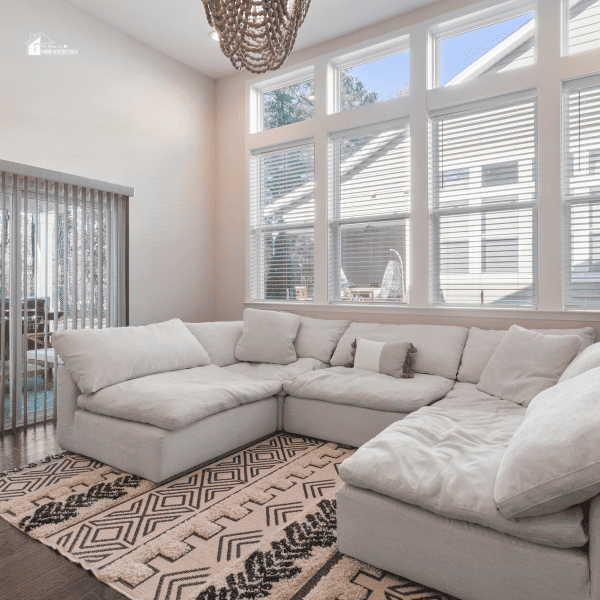
Covering Showdown: Blinds, Curtains, Cellular Shades, and DIY Layers
Run a Baseline Night Test
With window coverings fully open, log glass-surface and near-window air readings before bed and in the morning.
Add One Covering Type at a Time
On the next comparable night, close blinds, then repeat. Next, try curtains, then cellular shades, then a taped DIY layer (clear film or bubble wrap). Better energy efficiency usually shows up as warmer glass and a smaller window-to-wall temperature gap.
Log Condensation and Draft Sensation as Qualitative Data
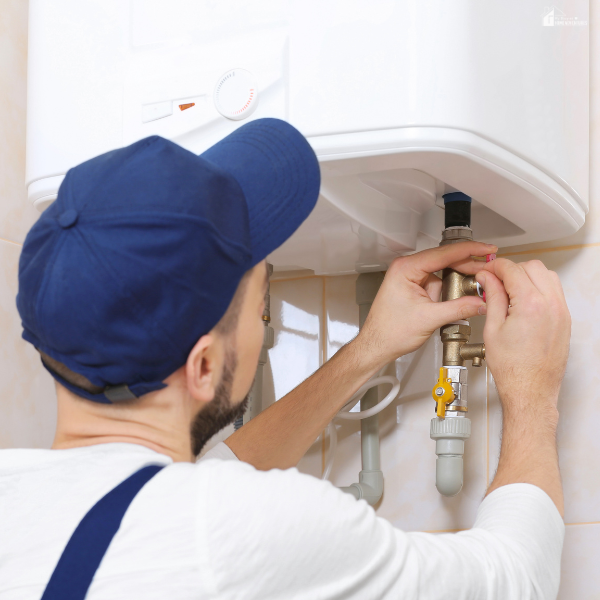
Alongside numbers, note condensation, musty odor, and whether a hand near the trim feels moving air. Persistent moisture between panes can point to a failed seal; wet sills, warped frames, or a strong draft often mean air leaks that coverings cannot fix. In those cases, an inspection from a window pro or GCL Home Services helps confirm repairs before investing in more window coverings.
Experiment: Test Passive Solar Gains With Sun, Shade, and Surface Color
A Room-By-Room Sun Map You Can Build In One Day
Morning/Afternoon Sun Patches
Pick two rooms and mark two floor spots with tape: one in direct sun and one always shaded. At the same times (9 a.m., 1 p.m., 5 p.m.), measure temperature at chest height in each spot. Repeat once with blinds open and once with window coverings closed to see the swing passive solar design can create.
Shaded vs Unshaded Zones
If the room has a sunny window ledge, add a quick surface test: place a white and a black poster board side by side in the sun for 20 minutes, then compare their surface temperature. This mimics how light versus dark finishes can change comfort near glazing.
Cloudy Day Notes
On an overcast day, repeat one set of readings and note reduced contrasts. Use results for seasonal shading choices in summer, furniture placement away from winter cold glass, and smarter use of coverings for energy efficiency.
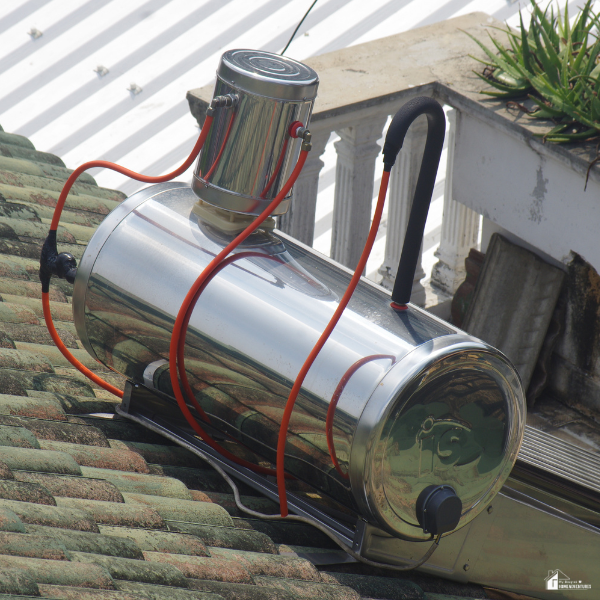
Experiment: Build a Simple Solar Water Heater and Track Heat Output
Build Options: Fastest Version vs Best-Performing Version
- Black hose coil in a clear bin
Materials: black hose or dark bottles, a clear-lid bin or box, foil, thermometer, and timer. Reuse packaging when possible.
Fastest: coil hose, fill with water, place in the sun. - Bottle-and-box mini collector
Best-performing: set dark bottles in a foil-lined box, cover with the lid.
Keep a control cup in shade, side by side.
Safety notes for hot water and sunlight: Use gloves, avoid glare, and do not drink test water.
How to Measure Performance
- Measure the starting water temperature
- Measure every 5 minutes until it stops rising. Record peak temperature and time to peak.
- Log peak temperature and the time it takes to peak
- Log temperature after 30–60 minutes to assess heat retention
Move both to shade and measure again after 30 and 60 minutes. Higher peaks usually mean stronger sun, more absorber area, or better insulation. Faster cooling often points to wind or gaps. Success is a repeatable rise above the control, linked to energy conservation in this science experiment.
Turn Measurements Into Upgrades: Interpreting Results and Choosing Your Next Move
What Counts as a Meaningful Difference (And What’s Just Noise)
Repeat trials
Run each test twice and average the readings. One odd temperature point can come from wind, a vent cycle, or a warm hand on the sensor.
Look for consistent gaps, not one-off spikes
Treat results as meaningful when the same spot stays warmer or colder across trials, not when one spike appears. That keeps the scientific method honest for energy efficiency planning.
Normalize for outdoor temperature changes
When outdoor temperature shifts, compare indoor differences (window vs interior wall, room A vs room B) instead of raw numbers. Note time of day and cloud cover.
A Quick Decision Guide for Common Findings
- Big window-related drop
Start with quick fixes: tighter window coverings at night and draft reduction at the trim. If the gap stays large, move to air sealing and insulation around the frame. - Fast heat loss in one room
If one room loses heat fast, look for attic or basement leaks, then add sealing and insulation where cooling is steepest. Consider bigger upgrades only after that. - Strong solar gain in a specific window
For strong solar gain, adjust shade in summer and keep winter sun when it helps. Log before/after tables so family members or contractors see shared evidence, and compare with other energy-saving hacks for your home.
Keep the Experiments Simple, Repeatable, and Useful
The most valuable takeaway is not a perfect thermometer or spreadsheet; it is a repeatable routine: measure, change one thing, then measure again.
When readings are taken in the same place, at similar times, and logged the same way, even simple tools can reveal patterns that matter for energy efficiency.
From here, the household can pick one improvement to test next, such as a single draft fix or one shade-setting change, and rerun the same notes and timing. Over time, those before-and-after comparisons show which changes improve comfort, and which are just noise.
Small, consistent checks build confidence, reduce guesswork, and keep energy conservation grounded in a practical science experiment.